 |
Research Article
Functional investigation and two-sample Mendelian randomization study of non-alcoholic fatty liver disease hub genes obtained by WGCNA
1 Department of General Surgery, The First Affiliated Hospital of Bengbu Medical University, Bengbu, Anhui, China
2 Department of General Surgery, The First Affiliated Hospital of Jinan University, Guangzhou, Guangdong, China
Address correspondence to:
Yunchuan Yang
Department of General Surgery, The First Affiliated Hospital of Bengbu Medical University, Bengbu 233000, Anhui Province,
China
Message to Corresponding Author
Article ID: 100110Z04YY2026
Access full text article on other devices

Access PDF of article on other devices


How to cite this article
Yang Y, Zhao Z, Huo J, Guo K, Ma X, Zhou C, Sun T, Zhou L. Functional investigation and two-sample Mendelian randomization study of non-alcoholic fatty liver disease hub genes obtained by WGCNA. Int J Hepatobiliary Pancreat Dis 2026;16(1):8–14.ABSTRACT
Aims: Non-alcoholic fatty liver disease (NAFLD) poses significant health risks with progression to severe liver pathologies, while its molecular mechanisms remain unclear. This study aimed to identify NAFLD hub genes and evaluate their clinical and causal value.
Methods: We performed differential expression analysis and weighted gene co-expression network analysis (WGCNA) on GSE89632 to screen NAFLD-related modules and hub genes, followed by Gene Ontology (GO) and Kyoto Encyclopedia of Genes and Genomes (KEGG) enrichment analyses. A nomogram model and Receiver Operating Characteristic (ROC) curves were constructed for diagnostic efficacy assessment, and the correlation between FOS (Fos proto-oncogene) expression and immune cell infiltration was analyzed. Two-sample Mendelian randomization (MR) was used to verify the causal relationship between FOS and NAFLD susceptibility.
Results: 115 key genes were obtained from the intersection of WGCNA module genes and differentially expressed genes (DEGs), enriched in fat cell differentiation, Tumor necrosis factor (TNF)/Mitogen-activated protein kinase (MAPK) signaling pathways, etc. The top 10 upregulated hub genes were FOS, JUN, Nuclear receptor subfamily 4 group A member 1 (NR4A1), JunB proto-oncogene, AP-1 transcription factor subunit (JUNB), Early growth response 1 (EGR1), MYC proto-oncogene, bHLH transcription factor (MYC), Interleukin 1 beta (IL1B), C-C motif chemokine ligand 2 (CCL2), C-X-C motif chemokine ligand 8 (CXCL8), Prostaglandin-endoperoxide synthase 2 (PTGS2). The nomogram model had good NAFLD prediction performance, and FOS, JUN, MYC had an AUC of 1.000 for diagnosis. FOS expression correlated with immune cell infiltration in NAFLD. The Mendelian randomization analysis found no causal link between FOS and NAFLD risk (OR = 0.997, 95% CI = 0.947–1.049, p = 0.898).
Conclusion: We identified 10 NAFLD-associated hub genes. These genes support early NAFLD diagnosis. They clarify NAFLD molecular mechanisms.
Keywords: FOS, Mendelian randomization, Non-alcoholic fatty liver disease, WGCNA
Introduction
With profound modern lifestyle changes, non-alcoholic fatty liver disease (NAFLD) has become an epidemic, imposing a heavy burden on global public health [1]. The non-alcoholic fatty liver disease encompasses a spectrum of liver disorders from simple hepatic steatosis to non-alcoholic steatohepatitis (NASH), and NASH patients are at high risk of cirrhosis and hepatocellular carcinoma (HCC) [2],[3]. Hepatic fibrosis, though not a diagnostic criterion for NAFLD, is frequently observed and linked to poor clinical outcomes [4].
Identifying disease-specific gene expression patterns elucidates NAFLD molecular mechanisms. It enables development of reliable diagnostic and therapeutic response biomarkers. Tools including WGCNA analyze high-dimensional datasets. The weighted gene co-expression network analysis screens therapeutic targets and diagnostic biomarkers [5],[6],[7]. Mendelian randomization (MR) is a robust method for inferring causal relationships between exposure factors and disease outcomes, overcoming confounding factors and reverse causality bias via single nucleotide polymorphisms (SNPs) as instrumental variables (IVs) [8],[9].
In the present research, we conducted an in-depth analysis of liver tissue transcriptomic profiles derived from NAFLD patients and healthy controls (HC). We first screened out DEGs between the two cohorts and then applied weighted WGCNA to mine gene modules that are closely associated with NAFLD pathogenesis. On this basis, we pinpointed hub genes with potential diagnostic value for NAFLD and further explored the causal link between FOS (Fos proto-oncogene) expression and NAFLD susceptibility through MR analysis. Our work is intended to yield novel insights into the clinical diagnosis of NAFLD and the in-depth investigation of its underlying molecular mechanisms.
MATERIALS AND METHODS
Data source
We retrieved the gene expression profile dataset GSE89632 from the Gene Expression Omnibus (GEO) database (https://www.ncbi.nlm.nih.gov/geo/), which encompasses detailed clinical characteristics as well as liver tissue gene expression data obtained via transcriptome microarray assays from 19 patients diagnosed with NAFLD and 24 healthy control subjects. All raw gene expression data were obtained directly from the GEO database.
Differentially expressed genes identification
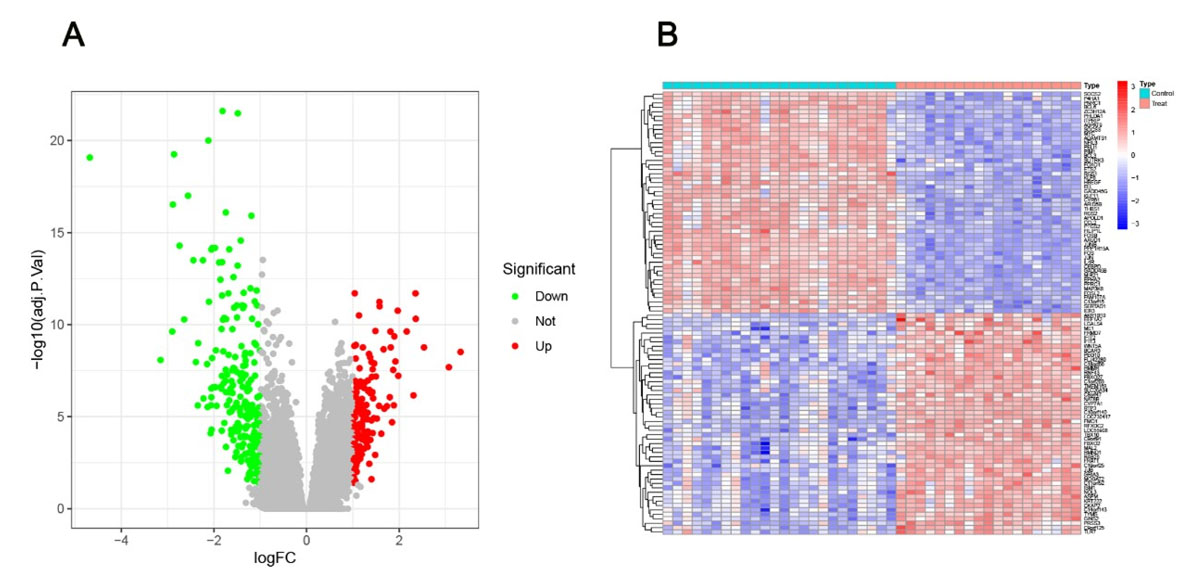
Initially, data from the GSE89632 dataset were read using R software (version 4.3.0) and then normalized. Subsequently, DEGs were screened with the “limma” package, applying a differential threshold of |log2FC| > 1 and FDR < 0.05. After statistical analysis to determine significance, volcano plots and heatmaps of DEGs were generated using the “pheatmap” and “ggplot2” packages in R (Figure 1).
Weighted gene co-expression network analysis
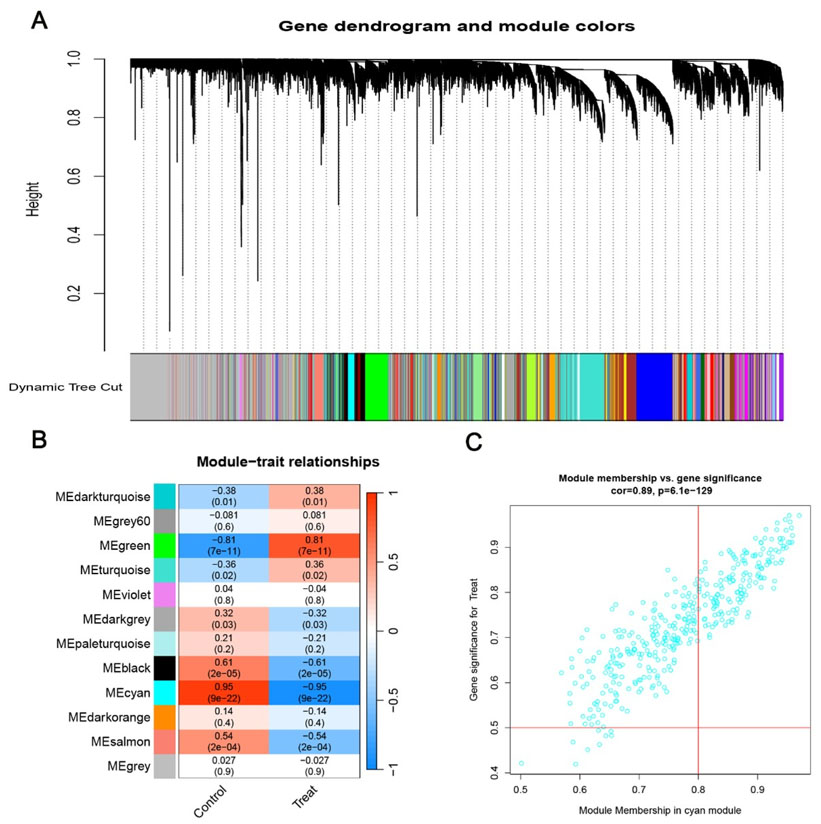
The R package “WGCNA” was used to construct a NAFLD-related gene co-expression network. A soft-thresholding power of 6 was selected based on the scale-free topology criterion (R² = 0.88), which ensured the constructed gene co-expression network approximated a scale-free network structure and minimized spurious correlations between genes. The correlation between different gene modules and NAFLD pathogenesis was evaluated, and the most disease-relevant module was selected to extract candidate hub genes (Figure 2). By quantifying pairwise gene expression correlations and their associations with phenotypic traits, WGCNA effectively identifies co-expressed gene modules with coordinated biological functions, making it a robust tool for prioritizing potential disease biomarkers.
Identification of candidate pivotal genes and GO/KEGG analysis
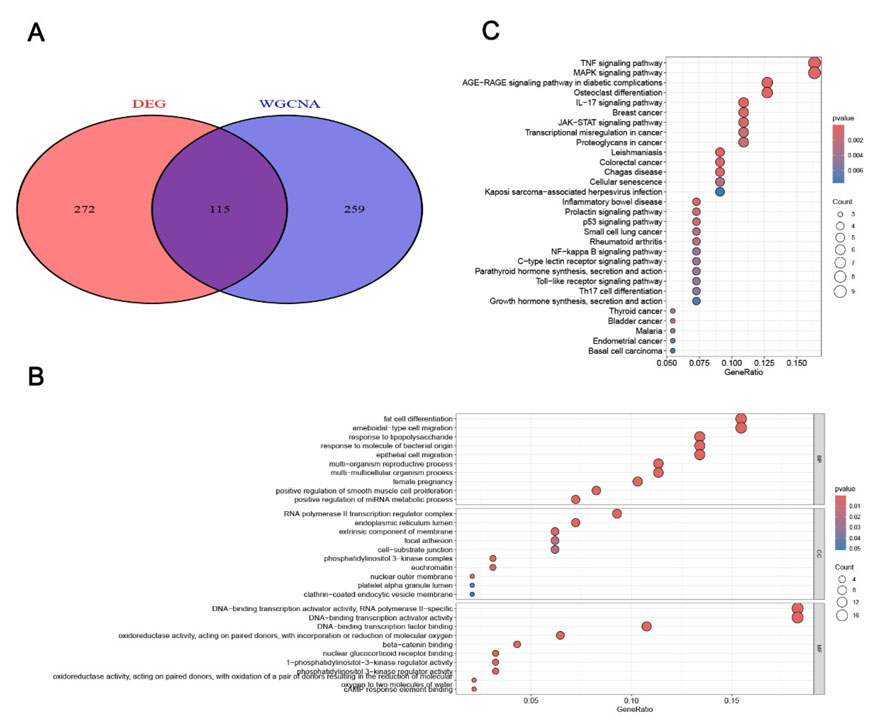
Genes overlapping between WGCNA-derived module genes and DEGs were defined as potential NAFLD-associated hub genes. The Gene Ontology (GO) and Kyoto Encyclopedia of Genes and Genomes (KEGG) enrichment analyses of the overlapping genes were performed using the R package “clusterProfiler” to explore NAFLD progression mechanisms, with the KEGG database used for systematic gene function analysis (Figure 3A, Figure 3B, Figure 3C).
Discovery of hub genes in the protein-protein interaction network
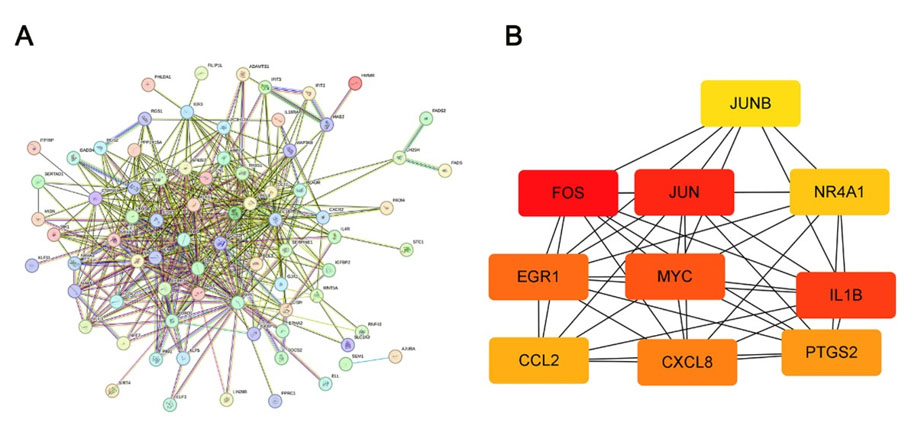
The STRING database (version 2) was used to construct protein–protein interaction (PPI) networks, which were visualized via Cytoscape software. The Degree algorithm in Cytoscape was applied to rank genes by connectivity in the PPI network, and the top-ranked genes were identified as NAFLD hub genes (Figure 4).
Nomogram model construction
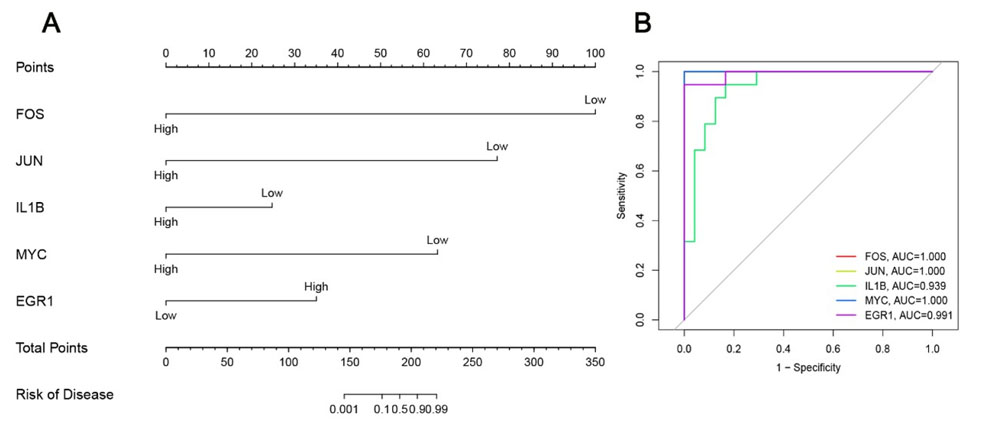
A nomogram model for NAFLD risk prediction was constructed using the R package “rms”. Harrell’s concordance index (C-index) was calculated to evaluate predictive power. The R package “pROC” was used to plot ROC curves and calculate the area under the ROC curve (AUC), with 0.9 ≤ AUC < 1 defined as excellent diagnostic accuracy (Figure 5).
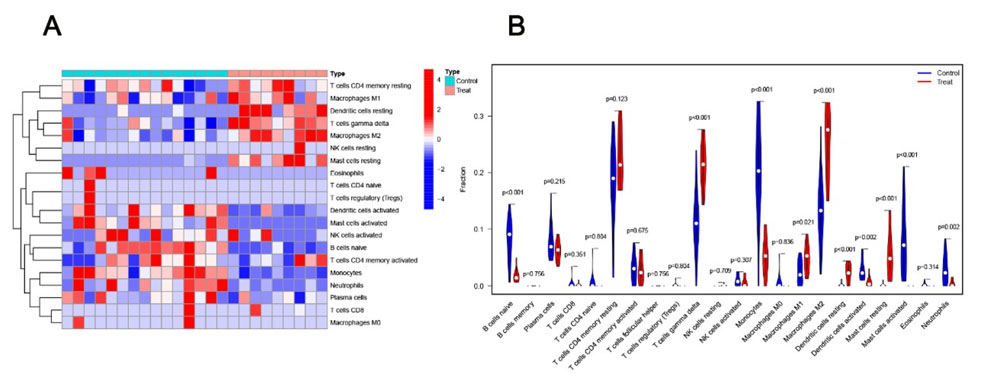
Immune cell infiltration analysis
We adopted the CIBERSORT algorithm to quantify the relative proportions of 22 distinct immune cell subpopulations, thereby characterizing the landscape of immune cell infiltration in NAFLD tissue samples. Furthermore, we performed a correlation analysis between FOS gene expression levels and the infiltration abundance of each immune cell subtype. Patients were divided into FOS high- and low-expression groups by median split, aiming to clarify the potential immunomodulatory function of FOS in the pathological progression of NAFLD (Figure 6).
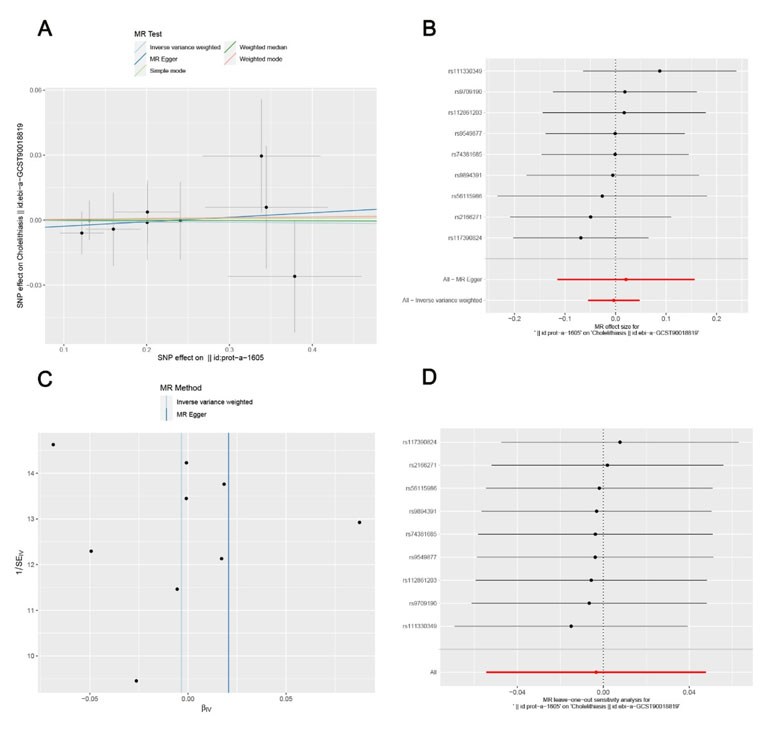
Mendelian randomization analysis
Two-sample MR analyses were conducted with the R package “TwoSampleMR” to probe into the causal relationship between FOS gene expression levels and the risk of developing NAFLD, in which SNPs were employed as IVs. Genome-wide association study (GWAS) data of FOS were retrieved from public repositories. The inverse variance weighting (IVW) method was the primary analysis, and MR-Egger regression was used for sensitivity analysis to detect horizontal pleiotropy. Leave-one-out sensitivity analysis was also conducted to verify result robustness (Figure 7). All data used were obtained from public databases.
RESULTS
Screening for DEGs
We screened DEGs between NAFLD and control groups in GSE89632. We identified 387 DEGs: 162 upregulated and 225 downregulated in NAFLD samples (Figure 1).
Construction of WGCNA network and identification of NAFLD-related module
We applied WGCNA to the GSE89632 dataset. We identified 12 independent gene co-expression modules with distinct expression patterns [10]. We calculated correlation coefficients to evaluate module–NAFLD associations. The cyan module showed the strongest positive correlation with NAFLD. We defined the cyan module as the NAFLD-related core module. It regulates NAFLD initiation and progression (Figure 2).
GO and KEGG enrichment analyses
A total of 115 overlapping genes were screened out from the intersection of the cyan module genes identified via WGCNA and the DEGs, and these genes were defined as potential hub genes associated with NAFLD (Figure 3A). The GO enrichment analysis showed these genes were mainly involved in biological processes such as fat cell differentiation, amoeboid-type cell migration, and response to lipopolysaccharide/bacterial origin molecules (Figure 3B). The Kyoto Encyclopedia of Genes and Genomes pathway enrichment analysis indicated enrichment in the TNF signaling pathway, MAPK signaling pathway, AGE-RAGE signaling pathway in diabetic complications, osteoclast differentiation, and IL-17 signaling pathway (Figure 3C) [11].
PPI network analysis for hub genes
The STRING online tool constructed a PPI network of the overlapping hub genes, and Cytoscape identified the top 10 upregulated genes with the highest connectivity scores: FOS, JUN, NR4A1, JUNB, EGR1, MYC, IL1B, CCL2, CXCL8, and PTGS2 (Figure 4). Color intensity in the plot represents connectivity score, with deeper colors indicating higher scores.
Development of a nomogram model for NAFLD risk stratification
A nomogram model incorporating the identified hub genes was established to predict the risk of NAFLD, and this model demonstrated robust predictive performance in clinical sample analysis (Figure 5A). We further conducted ROC curve analysis to evaluate the individual diagnostic value of five key hub genes (FOS, JUN, IL1B, MYC, EGR1), which all exhibited high diagnostic efficacy: the area under the ROC curve (AUC) values were 1.000 for FOS, 1.000 for JUN, 0.939 for IL1B, 1.000 for MYC, and 0.991 for EGR1, respectively (Figure 5B). The AUC value of the constructed nomogram also verified its strong capability to discriminate NAFLD patients from healthy control subjects accurately.
Analysis of immune cell infiltration characteristics in NAFLD tissues
Immune cell infiltration profiling uncovered distinct immune landscape patterns that were closely associated with FOS expression levels in NAFLD tissue samples (Figure 6). Samples were divided into FOS high-expression and low-expression groups using the median expression level of FOS as the cutoff value. In comparison with the FOS low-expression group, the FOS high-expression group presented markedly elevated infiltration abundances of γδ T cells, M1 macrophages, M2 macrophages, resting dendritic cells and resting mast cells. Conversely, the infiltration levels of naive B cells, plasma cells, monocytes, activated dendritic cells, activated mast cells and neutrophils were significantly lower in the FOS high-expression group. These findings confirm a direct and close correlation between FOS gene expression and the immune cell infiltration profile in the NAFLD microenvironment.
No causal association between FOS and NAFLD risk
The F-statistic of instrumental variables was greater than 10, indicating no weak instrument bias. Inverse variance weighting analysis showed no significant causal association between FOS levels and NAFLD risk (OR = 0.997, 95% CI = 0.947–1.049, p = 0.898) (Figure 7A and Figure 7B). The Mendelian randomization-Egger regression also showed no statistically significant causal relationship (OR = 1.021, 95% CI = 0.891–1.170, p = 0.774). The funnel plot showed a roughly symmetrical distribution of SNP effect sizes (Figure 7C), and the MR-Egger regression intercept was not statistically significant (p = 0.719), indicating no horizontal pleiotropy. Leave-one-out sensitivity analysis yielded consistent outcomes across all iterations (Figure 7D), which further validated the robustness and reliability of the Mendelian randomization analysis results.
DISCUSSION
The non-alcoholic fatty liver disease is a chronic liver disorder. It presents as excessive lipid accumulation in hepatocytes without heavy alcohol intake. Its molecular mechanisms remain unclear.
The non-alcoholic fatty liver disease progresses sequentially: fibrosis, cirrhosis, and HCC in severe cases. Its pathogenesis involves genetic susceptibility, metabolic dysregulation, and environmental factors [1],[2]. Lifestyle modification is first-line therapy. Targeted molecular treatments are urgently needed [12]. Molecular biology advances drive NAFLD gene research. Research aims to map regulatory networks and identify therapeutic targets [12]. Molecular biology advances drive NAFLD gene research. Research maps regulatory networks and identifies therapeutic targets.
We applied WGCNA and identified 10 candidate hub genes (FOS, JUN, NR4A1, JUNB, EGR1, MYC, IL1B, CCL2, CXCL8, PTGS2). The hub-gene-based nomogram model predicts NAFLD susceptibility accurately. Receiver Operating Characteristic analysis confirms high diagnostic efficiency for five core hub genes (FOS, JUN, IL1B, MYC, EGR1). These findings underscore the great potential of these genes to serve as promising tools for the clinical diagnosis and clinical management of NAFLD.
Cytoscape-based analysis revealed that FOS was the top-ranked hub gene within the constructed PPI network, which implies that this gene may exert a central regulatory function in the molecular regulatory networks linked to NAFLD pathogenesis. As a classic proto-oncogene, FOS (c-fos) encodes a transcription factor belonging to the activator protein-1 (AP-1) family; this factor forms a heterodimer with Jun family proteins, thereby mediating the transcriptional regulation of downstream target genes [13],[14]. FOS can be rapidly induced by a variety of extracellular stimulatory signals and has been the subject of extensive investigation in oncology research, with its dysregulated expression being detected in a wide range of malignant tumors, including hepatic carcinoma [15],[16],[17]. In addition, FOS is involved in immune responses, inflammation, and metabolic diseases [18],[19].
A previous study demonstrated that the AP-1 complex plays a crucial role in NAFLD development: FOS promotes PPARγ expression, and different AP-1 dimers uniquely regulate PPARγ at the transcriptional level, making AP-1 a key link between obesity, hepatic lipid metabolism, and NAFLD [20]. To the best of our knowledge, this is the first study to investigate the causal relationship between FOS levels and NAFLD risk using two-sample MR analysis based on comprehensive GWAS data. Mendelian randomization results did not support a causal association between elevated FOS levels and increased NAFLD risk, with MR effectively reducing systematic biases in traditional observational studies and accurate genotyping minimizing regression dilution bias, ensuring result reliability [8],[9].
This study is subject to several limitations. Firstly, owing to the scarcity of available microarray data for NAFLD, our analysis was restricted to the single GSE89632 dataset; the integration of multiple independent datasets would undoubtedly enhance the robustness and generalizability of our findings. Secondly, hub gene identification and analysis relied solely on bioinformatics. In vitro and in vivo experiments are required to clarify their regulatory mechanisms in NAFLD. Thirdly, MR analysis used GWAS data from European populations only. Results do not generalize to other ethnic groups. Fourth, the AUC values of 1.000 observed for FOS, JUN, and MYC may reflect potential overfitting caused by the relatively small sample size (19 NAFLD vs 24 controls), which should be interpreted with caution.
Conclusion
We built a WGCNA-based gene co-expression network. We screened NAFLD-associated hub genes. These genes clarify NAFLD molecular regulatory pathways. Among these identified genes, the core hub genes including FOS, JUN, IL1B, MYC and EGR1 exhibited high diagnostic efficiency for NAFLD, and the nomogram model developed on this basis also demonstrated robust performance in predicting NAFLD risk. Two-sample MR found no causal link between FOS expression and NAFLD susceptibility. FOS correlated with immune cell infiltration in NAFLD tissues. FOS regulates the NAFLD immune microenvironment. These findings support targeted NAFLD interventions and personalized therapy. They improve early screening, optimize clinical management, and reduce global NAFLD burden.
REFERENCES
1.
Yip TCF, Vilar-Gomez E, Petta S, Yilmaz Y, Wong GLH, Adams LA, et al. Geographical similarity and differences in the burden and genetic predisposition of NAFLD. Hepatology 2023;77(4):1404–27. [CrossRef]
[Pubmed]

2.
Pierantonelli I, Svegliati-Baroni G. Nonalcoholic ratty liver disease: Basic pathogenetic mechanisms in the progression from NAFLD to NASH. Transplantation 2019;103(1):e1–13. [CrossRef]
[Pubmed]
3.
Gupta T. Nonalcoholic steatohepatitis and hepatocellular carcinoma: Beyond the boundaries of the liver. World J Gastroenterol 2022;28(36):5380–2. [CrossRef]
[Pubmed]
4.
Ji Y, Wei CB, Gu W, Hou LL. Relevance of vitamin D on NAFLD and liver fibrosis detected by vibration controlled transient elastography in US adults: A cross-sectional analysis of NHANES 2017–2018. Ann Med 2023;55(1):2209335. [CrossRef]
[Pubmed]
5.
Guan J, Lin Y, Wang Y, Gao J, Ji G. An analytical method for the identification of cell type-specific disease gene modules. J Transl Med 2021;19(1):20. [CrossRef]
[Pubmed]
6.
Wang R, Zeng H, Xiao X, Zheng J, Ke N, Xie W, et al. Identification of prognostic biomarkers of breast cancer based on the immune-related gene module. Autoimmunity 2023;56(1):2244695. [CrossRef]
[Pubmed]
7.
Lai Z, Bai Z, Yang S, Zhang R, Xi Y, Xu J. Hub genes in adenocarcinoma of the esophagogastric junction based on weighted gene co-expression network analysis and immunohistochemistry. Transl Oncol 2023;37:101781. [CrossRef]
[Pubmed]
8.
Roychowdhury T, Klarin D, Levin MG, Spin JM, Rhee YH, Deng A, et al. Genome-wide association meta-analysis identifies risk loci for abdominal aortic aneurysm and highlights PCSK9 as a therapeutic target. Nat Genet 2023;55(11):1831–42. [CrossRef]
[Pubmed]
9.
Yuan S, Ruan X, Sun Y, Fu T, Zhao J, Deng M, et al. Birth weight, childhood obesity, adulthood obesity and body composition, and gastrointestinal diseases: A Mendelian randomization study. Obesity (Silver Spring) 2023;31(10):2603–14. [CrossRef]
[Pubmed]
10.
Langfelder P, Horvath S. WGCNA: An R package for weighted correlation network analysis. BMC Bioinformatics 2008;9:559. [CrossRef]
[Pubmed]
11.
Geistlinger L, Csaba G, Santarelli M, Ramos M, Schiffer L, Turaga N, et al. Toward a gold standard for benchmarking gene set enrichment analysis. Brief Bioinform 2021;22(1):545–56. [CrossRef]
[Pubmed]
12.
Ratziu V, Hompesch M, Petitjean M, Serdjebi C, Iyer JS, Parwani AV, et al. Artificial intelligence-assisted digital pathology for non-alcoholic steatohepatitis: Current status and future directions. J Hepatol 2024;80(2):335–51. [CrossRef]
[Pubmed]
13.
Song D, Lian Y, Zhang L. The potential of activator protein 1 (AP-1) in cancer targeted therapy. Front Immunol 2023;14:1224892. [CrossRef]
[Pubmed]
14.
Cordier F, Creytens D. New kids on the block: FOS and FOSB gene. J Clin Pathol 2023;76(11):721–6. [CrossRef]
[Pubmed]
15.
Pérez-Benavente B, Fathinajafabadi A, de la Fuente L, Gandía C, Martínez-Férriz A, Pardo-Sánchez JM, et al. New roles for AP-1/JUNB in cell cycle control and tumorigenic cell invasion via regulation of cyclin E1 and TGF-?2. Genome Biol 2022;23(1):252. [CrossRef]
[Pubmed]
16.
Bakiri L, Hamacher R, Graña O, Guío-Carrión A, Campos-Olivas R, Martinez L, et al. Liver carcinogenesis by FOS-dependent inflammation and cholesterol dysregulation. J Exp Med 2017;214(5):1387–409. [CrossRef]
[Pubmed]
17.
da Silva Queiroz JP, Pupin B, Bhattacharjee TT, Uno M, Chammas R, Vamondes Kulcsar MA, et al. Expression data of FOS and JUN genes and FTIR spectra provide diagnosis of thyroid carcinoma. Spectrochim Acta A Mol Biomol Spectrosc 2024;304:123305. [CrossRef]
[Pubmed]
18.
Liyanagamage DSNK, McColl LK, Glasgow LNM, Levine AS, Olszewski PK. Effect of intranasal oxytocin on palatable food consumption and c-Fos immunoreactivity in relevant brain areas in rats. Physiol Behav 2023;271:114318. [CrossRef]
[Pubmed]
19.
Matsuoka K, Bakiri L, Bilban M, Toegel S, Haschemi A, Yuan H, et al. Metabolic rewiring controlled by c-Fos governs cartilage integrity in osteoarthritis. Ann Rheum Dis 2023;82(9):1227–39. [CrossRef]
[Pubmed]
20.
Hasenfuss SC, Bakiri L, Thomsen MK, Williams EG, Auwerx J, Wagner EF. Regulation of steatohepatitis and PPARγ signaling by distinct AP-1 dimers. Cell Metab 2014;19(1):84–95. [CrossRef]
[Pubmed]
SUPPORTING INFORMATION
Acknowledgments
The authors thank all participants and researchers involved in the GWAS studies used in this research for their valuable contributions. This study was supported by the Natural Science Youth Project of Bengbu Medical University (No. 2024byzd085) and the 2024 Science and Technology Innovation Guidance Program of Bengbu City (No. 18).
Artificial Intelligence (AI) Use Statement
No generative AI technology was used in the conception, design, data analysis, interpretation, or writing of this manuscript. All content was created and reviewed by the authors, who take full responsibility for the accuracy and integrity of the work.
Yunchuan Yang - Conception of the work, Design of the work, Drafting the work, Final approval of the version to be published, Agree to be accountable for all aspects of the work in ensuring that questions related to the accuracy or integrity of any part of the work are appropriately investigated and resolved.
Zhengxin Zhao - Acquisition of data, Analysis of data, Drafting the work, Final approval of the version to be published, Agree to be accountable for all aspects of the work in ensuring that questions related to the accuracy or integrity of any part of the work are appropriately investigated and resolved.
Junyi Huo - Acquisition of data, Analysis of data, Drafting the work, Final approval of the version to be published, Agree to be accountable for all aspects of the work in ensuring that questions related to the accuracy or integrity of any part of the work are appropriately investigated and resolved.
Ke Guo - Acquisition of data, Analysis of data, Drafting the work, Final approval of the version to be published, Agree to be accountable for all aspects of the work in ensuring that questions related to the accuracy or integrity of any part of the work are appropriately investigated and resolved.
Xiang Ma - Conception of the work, Design of the work, Revising the work critically for important intellectual content, Final approval of the version to be published, Agree to be accountable for all aspects of the work in ensuring that questions related to the accuracy or integrity of any part of the work are appropriately investigated and resolved.
Chi Zhou - Revising the work critically for important intellectual content, Final approval of the version to be published, Agree to be accountable for all aspects of the work in ensuring that questions related to the accuracy or integrity of any part of the work are appropriately investigated and resolved.
Tao Sun - Acquisition of data, Analysis of data, Drafting the work, Final approval of the version to be published, Agree to be accountable for all aspects of the work in ensuring that questions related to the accuracy or integrity of any part of the work are appropriately investigated and resolved.
Lei Zhou - Revising the work critically for important intellectual content, Final approval of the version to be published, Agree to be accountable for all aspects of the work in ensuring that questions related to the accuracy or integrity of any part of the work are appropriately investigated and resolved.
Guarantor of SubmissionThe corresponding author is the guarantor of submission.
Source of SupportNone
Consent StatementWritten informed consent was obtained from the patient for publication of this article.
Data AvailabilityAll relevant data are within the paper and its Supporting Information files.
Conflict of InterestAuthors declare no conflict of interest.
Copyright© 2026 Yunchuan Yang et al. This article is distributed under the terms of Creative Commons Attribution License which permits unrestricted use, distribution and reproduction in any medium provided the original author(s) and original publisher are properly credited. Please see the copyright policy on the journal website for more information.


