|
Research Article
Identification of biomarkers and enrichment analysis in pancreatic adenocarcinoma through transcriptome analysis
1 Faculty, Department of Emergency Medical Services, Prince Sultan Bin Abdulaziz College for EMS, King Saud University, Riyadh, Saudi Arabia
2 Researcher, Department of Emergency Medical Services, Prince Sultan Bin Abdulaziz College for EMS, King Saud University, Riyadh, Saudi Arabia
3 Researcher, College of Nursing, King Saud University, Riyadh, Saudi Arabia
4 Faculty, Department of Family Medicine, King Fahad Medical City, Riyadh, Saudi Arabia
Address correspondence to:
Ehtesham Ahmed Shariff
Faculty, Department of Emergency Medical Services, Prince Sultan Bin Abdulaziz College for EMS, King Saud University, Riyadh,
Saudi Arabia
Message to Corresponding Author
Article ID: 100106Z04ES2025
Access full text article on other devices

Access PDF of article on other devices


How to cite this article
Shariff EA, Khan A, Hasan Z, Azharuddin A, Tabassum R, Al-Enazi KM. Identification of biomarkers and enrichment analysis in pancreatic adenocarcinoma through transcriptome analysis. Int J Hepatobiliary Pancreat Dis 2025;15(1):1–16.ABSTRACT
Aims: Pancreatic cancer is a major disease to fatalities worldwide. To understand its molecular mechanisms is crucial for improving diagnosis and treatment. We aim to identify key biomarkers and biological pathways associated with pancreatic adenocarcinoma using RNA sequencing data from The Cancer Genome Atlas (TCGA). To analyze differentially expressed genes in pancreatic cancer, performed enrichment analysis to uncover crucial biological processes and cellular components, evaluated the impact of identified genes on patient survival and prognosis.
Methods: We examined RNA sequencing data from TCGA to identify differentially expressed genes (DEGs), crucial biological processes, and cellular components associated with pancreatic cancer. Enrichment analysis was conducted to pinpoint significant genes involved in various pathways, and survival analysis was performed to assess the impact of these genes on patient outcomes.
Results: Our analysis identified several significant genes linked to pancreatic cancer, including EDN1, KDM1A, KDM5D, KDM6A, NLGN4Y, RASGRP, SQLE, TMSB4Y, TNF, USP9Y, 1UTY, and ZRSR2. Notably, Ras guanyl nucleotide-releasing protein (RASGRP), tumor necrosis factor (TNF), and ZRSR2 showed lower expression levels than normal tissues, while KDM1A and KDM3A were significantly overexpressed, correlating with poor prognostic outcomes. Survival analysis indicated that EDN1, KDM1A, RASGRP, and squalene epoxidase (SQLE) are associated with mortality risk or disease recurrence.
Conclusion: Our findings highlight key biomarkers and pathways involved in pancreatic cancer, emphasizing the potential of KDM1A and KDM3A as therapeutic targets. By identifying these biomarkers, we aim to contribute to developing targeted therapies that could enhance patient prognoses and improve treatment strategies for pancreatic cancer.
Keywords: Biomarkers, Enrichment analysis, Pancreatic cancer, RNA-Seq, Survival analysis, Transcriptome
Introduction
Pancreatic cancer, also known as pancreatic adenocarcinoma (PAAD), is a type of cancer that affects the cells of the pancreas. It occurs slightly more frequently in men than in women [1]. Several risk factors such as cigarette smoking, and age are related to PAAD occurrences [2]. Certain inherited gene mutations in familial pancreatitis or hereditary breast and ovarian cancer syndromes can increase the risk of pancreatic cancer [3]. Higher risk of PAAD is also have direct association with especially type 2 diabetes patients [4]. Individuals with chronic inflammation of the pancreas and viral infections like hepatitis B or C have also shown features linked with pancreatic cancer [5]. Genetic mutations such as SMAD4 affected DNA repair, CDKN2A disrupted cell cycle and alterations in DNA repair mechanism contributes in progression of pancreatic cancer [6]. Disruption in DNA repair pathway leads to alterations in DNA methylation, histone modification, and non-coding RNA expression that causes pancreatic cancer [7]. The epigenetic changes can affect the expression of genes involved in critical cellular processes, such as cell growth, differentiation, and apoptosis, consequently promote pancreatic cancer. Epigenetic changes in pancreatic cancer show poor prognosis and resistance to chemotherapy [8]. To overcome this issue we should emphasize to understand the mechanisms of causes and thrive for developing effective therapies. Pancreatic adenocarcinoma can be of several types based on location and cells in pancreas [9]. Due to rapid spread, invasiveness, and complex genomics of PAAD make it difficult to treat [10]. Despite these challenges, surgery, chemotherapy, and radiation therapy treatment are available to teat PAAD [11].
The ductal cells of the pancreas are the primary cells affected by pancreatic ductal adenocarcinoma [12]. A pancreatic neuroendocrine tumor causes symptoms like flushing, diarrhea, and low blood sugar, when functional, while non-functional tumors invariably grow to affect nearby tissues [13]. Less common types of pancreatic cancer include acinar cell carcinoma, adenosquamous carcinoma, and solid pseudopapillary neoplasms [14]. Based on diagnosis and cancer stage treatment of pancreatic cancer can be performed with various type of allopathic methods [15]. Palliative care is recommended for advanced stage pancreatic cancer that is not suitable for surgery. Main purpose of palliative care is to improve quality of life by addressing symptoms like pain, nausea, and fatigue through pain management, nutritional support, and other therapies [16].
Many genes such as tumor suppressor genes, oncogenes, and gens involved in epigenetic modification have shown mutation in pancreatic cancer patients [17]. There are targeted therapies available for identification and regulating the genes causing PAAD [18]. Recurrence risk of PAAD in high, to control this risk identification of biomarkers that predict recurrence risk can help guide treatment decisions and improve patient outcomes [19]. RNA-Seq analysis is a powerful tool that can be used to identify these biomarkers. Analysis of RNA-Seq data can help us to understand the gene expression and molecular changes associated with PAAD [20]. RNA-Seq-based identification of DEGs in PAAD can help to understand the molecular mechanisms underlying this deadly disease. Differentially expressed genes enrichment analysis helps to identify biological processes, molecular functions, and cellular components that are overrepresented in a set of genes. RNA-Seq analysis may clarify the functional significance of the identified DEGs and enhance our overall understanding of the mechanisms underlying PAAD [21],[22].
Pancreatic cancer, specifically PAAD, poses significant treatment challenges due to its rapid spread and complex genomics. This study aims to identify key biomarkers and pathways associated with PAAD through RNA-Seq analysis, hypothesizing that specific DEGs will correlate with disease progression and treatment response. By elucidating the molecular mechanisms underlying PAAD, we seek to enhance diagnostic accuracy and therapeutic strategies, ultimately improving patient outcomes.
MATERIALS AND METHODS
Expression and clinical data collection from TCGA
Transcriptomic profiling data of pancreatic cancer was collected from the Cancer Genome Atlas (TCGA) and the Genomic Data Commons (GDC). We have downloaded the TCGA data by using TCGA biolinks [23] an R package directly from GDC. Transcriptome profile data were collected from TCGA-PAAD project. Gene expression quantification of pancreatic cancer data had been done with RNA-Seq experimental strategy or technology, for both tumor and normal tissue samples. Pancreatic cancer data also have information on many clinical features such as gender, type, race, and tumor stage that can be used to correlate gene expression patterns with clinical outcomes. We have downloaded 182 count cases out of which 178 were primary tumor and 4 were normal count cases. Gender wise pancreatic cancer was observed in 82 females and 100 males. All the material and methods were performed in R v4.2.3 environment (https://www.R-project.org/) [24] and Bioconductor [25] package.
Data preprocessing and normalization
RNA-Seq data often exhibit significant noise and variability, influenced by factors such as read length, sequencing depth, and library preparation. Effective preprocessing is essential to eliminate this noise and variability, allowing for the detection of genuine biological signals and correction of biases, making the data comparable across different samples. This preprocessing smoothens the data, facilitating a more straightforward analysis of DEGs. For preprocessing of data we used edgeR [26] and voom [27] R packages. We have also used limma [28] and DESeq2 [29] an R package for DEGs analysis.
After preprocessing the data normalization process was performed. We used limma R package [28] and trimmed mean of M-values (TMM) method [30] for data normalization. The TMM method determines scaling factors for each sample by analyzing the distribution of gene expression data. R package voom was used to normalize RNA-Seq data by converting read counts to log2-counts per million (logCPM) values, and then fitting a linear model to the logCPM values. Data normalization was performed before conducting any downstream analysis. The Cancer Genome Atlas biolinks package was used to download the raw count RNA-Seq data [23]. A statistical method mean-variance trend (MVT) was used to mean variance the data [27]. The MVT is a statistical method that plots the mean-variance trend of the data. The variance across data stabilized and noise in the data were reduced by filtering low-expression genes.
Unsupervised classification of RNA-Seq data
Following normalization, we partitioned the data into training and testing sets. We proceeded to train an Elastic Net model [31], a generalized linear model that effectively merges the strengths of Ridge Regression [31] and LASSO [32]. After training, we assessed the model’s performance which demonstrated exceptional accuracy, with sensitivity, specificity, and precision all achieving a perfect score of 1. We identified the relevant genes that exhibited non-zero coefficients. We used unsupervised learning method to identify patterns and structures in the data. Principal component analysis (PCA) method was used to identify differentially expressed genes among subtypes of pancreatic cancer [33]. We also employed the caret R package [34], which offers a range of methods for training and testing machine learning models, as well as evaluating their performance. Additionally, the glmnet R package [35] was utilized to fit generalized linear models, enabling us to analyze high-dimensional gene expression data effectively. Differentially expressed genes were analyzed using limma [28], edgeR [26], and DESeq2 [29] R packages. Cutoff values of log2|fold change|>1 and a false discovery rate of
Survival analysis of pancreatic cancer data
Survival analysis was employed to examine mortality and the progression of disease in patients with pancreatic cancer. An R package SummarizedExperiment [36] was utilized to integrate gene expression, clinical information, and genomic annotations. Another method, “survival” R package [37], was used for cancer data survival analysis and visualization. The Cox analysis [38] was deployed to identify relationship between gene expression and patient survival. Another package survminer [39] was used to visualize and summarize the survival data. Survival analysis hazard ratio (HR) and p value at p
Enrichment analysis and data visualization
Differentially expressed genes were analyzed by enrichR [40] for enrichment analysis. Gene ontology [41] function was used to identify the genes associated with biological process, cellular components, and molecular functions. Enrichment for Kyoto Encyclopedia of Genes and Genomes (KEGG) pathway [42] and WikiPathway [43] was also performed. Cytoscape [44], a robust network analysis platform, has facilitated the creation of a network that elucidates the complex interplay of multiple signaling pathways in pancreatic cancer. The pathway findings reveal critical interactions and potential therapeutic targets that may enhance our understanding of disease mechanisms. Analyzed RNA-Seq data were visualized by different plots by using gplots [45], ggplot2 [46], cowplots [47] packages. For the interactive visualization of gene expression data we used Glimma R package [48]. RColorBrewer [49] is an R package that provides a collection of color palettes for creating visually appealing plots.
RESULTS
We employed several statistical methods to ensure transparency and clarity in our results. P-values were calculated to assess the significance of differences in gene expression, with a threshold set at p < 0.05. Confidence intervals were determined for mean expression levels to provide a reliable range for the true mean. Differential expression analysis was conducted using the limma package, which utilizes linear models and empirical Bayes methods. Principal component analysis was performed to visualize variance and distinct patterns in gene expression across conditions, while cross-validation was implemented to evaluate the classification model’s performance, achieving high sensitivity, specificity, and precision.
Mean variance and PCA analysis
Our result shows the mean-variance trend for two different tissue types: primary tumor and normal tissue. Mean expression level of data were shown in the x-axis of plot as the base log2, while the y-axis represented the square root of the variance (Figure 1A). There was a clear separation of primary tumor and normal tissue samples based on different expression level.
Gender-specific differences in cancer dataset were studied between male and female. Expression pattern for both gender shows cancer in males was more variable compared to females. This trend of higher degree of variance in male is male-specific factors in pancreatic cancer data. The MVT for females shows a more consistent pattern along the expression level across samples (Figure 1B). Result shows the variance of highly expressed genes tends to increase with higher mean expression value. Relationship between variance and mean expression level helps to predict the best differential expression. The MVT for pancreatic cancer types is shown in Figure 1C and MVT plot based on race are shown in Figure 1D. Result shows the consistency between the variance and the mean expression pattern of pancreatic cancer.
Principal component analysis based on condition variable definition shows distinction between primary solid tumor and solid tissue normal. It captures the spread between ranges of −200 to 100 in primary solid tumor. It plots of PC1 versus PC2 shows higher number of tumor and very less number of normal tissues (Figure 1E).
Gender-specific pattern of RNA expression profile was also plotted using PCA. Two main component PC1 and PC2 cover a spread of –250 to 100 for both the genders. Male-specific cancer samples were higher compare to female (Figure 1F). There was some degree of heterogeneity observed within tumor samples. This indicates that not all pancreatic tumors are the same, and there are subtypes of pancreatic cancer having different expression profile (Figure 1G). Finding shows there are cancer at body, head, tail, overlapping lesion, and nitric oxide synthase (NOS) of pancreas. We have also plotted the result for pancreatic cancer based on race condition. Principal component analysis result shows the race-wise samples have a well-separated RNA expression profile. Higher spread of cancer was observed in white people while Asians, Black or African American, and for others show less number of cancer patient (Figure 1H). Inflammation and immune response genes were strongly expressed in females, while DNA repair and cell proliferation genes were higher in males, indicating distinct molecular mechanisms for pancreatic cancer progression and potential for personalized therapies.
Classification and hierarchical clustering of RNA-Seq data
We split the data into training and testing sets to train a classification model and evaluate its performance on unseen data. Using cross-validation, the model achieved perfect scores of 1 for sensitivity, specificity, and precision, indicating high accuracy in classification. This research examined RNA-Seq data from pancreatic cancer patients alongside healthy controls, focusing on 21,384 DEGs. These DEGs were categorized into upregulated and downregulated genes based on their expression levels. We employed a hierarchical clustering algorithm to group our samples, utilizing classifications determined by the Elastic Net model. In the resulting visualizations, genes marked in red represent normal solid tissues, black highlights indicate primary solid tumors, while the green highlights denote genes also identified by the limma package. To illustrate the gene expression patterns within the clusters, we created a heatmap using the limma gene heatmap function, revealing distinct expression profiles across the different gene categories (Figure 2A).
Differentially expressed genes and enrichment analysis
Differentially expressed genes in human pancreatic cancer were illustrated using both a volcano plot and an enhanced volcano plot (Figure 2B and Figure 2C). The volcano plot features the log2 fold change of gene expression on the x-axis and the negative log10 of the p-value on the y-axis (Figure 2B). The log2 fold change indicates variations in gene expression between the two conditions, while the p-value represents the statistical significance of these differences. A smaller p-value signifies a more substantial disparity in expression levels.
In the enhanced volcano plot, additional information is incorporated into the standard volcano visualization. Beyond displaying log2 fold change and p-value, enhanced volcano plots include gene annotations such as gene names, pathways, and functional roles. This enriched visualization facilitates the identification of the biological processes influenced by differentially expressed genes. Each point in the enhanced volcano plot corresponds to an individual gene, with the color coding indicating the level of significance. Genes demonstrating a high log2 fold change and a low p-value are represented in red, while those with a low log2 fold change and a high p-value are shown in blue. Genes with intermediate values are marked in gray or green (Figure 2C).
We conducted an enrichment analysis on the DEGs to assess whether they are associated with specific biological functions. This analysis revealed the biological pathways, cell types, and molecular functions that are significantly impacted by pancreatic cancer. The gene ontology enrichment indicated that key biological processes (Figure 3A), cellular components (Figure 3B), and molecular functions (Figure 3C) are notably influenced by pancreatic cancer.
The research aimed to investigate the pathways affected by this type of cancer. We identified the most significantly altered KEGG pathways (Figure 3D), Reactome pathways (Figure 3E), and WikiPathways (Figure 3F) associated with human pancreatic cancer. Our findings highlighted that pathways related to histone demethylation, chromatin modification, and TNF & T cell signaling were particularly enriched among the differentially expressed genes. Since these pathways play a crucial role in cancer development and progression, recognizing their involvement in pancreatic cancer enhances our understanding of the disease.
Gene network and pathway analysis
The result shows that key pathways involved in PAAD include the notch-mediated HES-HEY network (Figure 4A), regulation of Ras family activation (Figure 4B), and EGFR-dependent endothelin signaling events (Figure 4C). Endothelins, which regulate blood pressure and cell proliferation (Supplementary Figure SF1), are involved in the TCR signaling network in naïve CD8 T-cells affected by PAAD. T-cell receptor (TCR) signaling in T cells is crucial for immune function (Supplementary Figure SF2). In PAAD, changes in TCR signaling may lead to immune dysfunction and tumor evasion, enabling cancer cells to grow and spread unchecked.
Research on pathways involved in pancreatic cancer development has identified two key pathways. The first, WP197, is the cholesterol biosynthesis pathway in human (Supplementary Figure SF4A), responsible for cholesterol production, essential for cell membranes and various important molecules. The second pathway is WP732 (Supplementary Figure SF4B), involving serotonin receptor 2 and ELK-SRFGATA4 signaling in Homo sapiens. Serotonin, a neurotransmitter, plays a role in mood regulation, sleep, and appetite.
Survival analysis of pancreatic cancer data
The relationship between time and survival probability for differentially expressed genes of pancreatic cancer visualized through Kaplan–Meier (KM) plots (Supplementary Figure SF5). Result shows that there is similar trend in survival probability of male and female until the 700 day mark, after that it got worse (Supplementary Figure SF5A). We tested event curves using the logrank test, a statistical method for comparing survival curves of multiple groups to identify significant differences. This test assumes group independence and is conducted over time intervals. The plot indicates that gender does not significantly affect prognosis in this pancreatic cancer dataset (Supplementary Figure SF5B). We visualized the KM plot (Supplementary Figure SF5C) showing that most pancreatic cancer patients die or are censored before 700 days. The p-value indicates the statistical significance of survival curve differences, with a small p-value suggesting significance. Additionally, we analyzed survival across different tumor stages. The Kaplan–Meier plot illustrates survival probabilities over time for each stage, with the logrank test assessing significant differences (Supplementary Figure SF5D). Despite low patient numbers in stages III, IV, and 1A, survival probability remains high, with results showing less than 500 days.
Visualizing gene expression and survival plot
We systematically examined the expression levels of twelve key genes to assess their impact on survival outcomes. Each gene’s expression was compared to the survival duration of patients in the study (Figure 5). Through our analysis of the survival plots, we established relationships between specific gene expressions and survival outcomes, identifying genes associated with improved or diminished survival rates. Additionally, we evaluated gene expression across various conditions, including tumor versus normal tissue and different cancer stages, to quantify the extent of expression differences. This differential expression was visualized in bar plots, illustrating the contrasting gene expression levels across sample types (Supplementary Figure SF3) and cancer stages (Figure 6), thereby highlighting the significance and magnitude of these variations.


Discussion
Our finding shows upregulated and downregulated DEGs in PAAD. The pattern of gene expression profile among male and female indicates the higher frequency of occurrence in male (Figure 1F). Clustering analysis identified co-expressed genes among cells cluster, and potential biomarkers have listed in heatmap diagram (Figure 2A). We have identified CD5L, LILRB1, KEL, DOK3, LEFTY2, ALAS2, BMF, HMOX, and SIGLEC11 as differentially expressed genes in PAAD. Key DEGs have a low p-value and a large log fold change (LFC) appears at the top of the plot forming a volcano shape (Figure 2A). Certain biological processes and pathways involving these genes may drive PAAD across cell populations. Key pathways include histone demethylation, actin filament regulation, nitric oxide regulation, and oxidoreductase activity, all associated with pancreatic cancer initiation and progression.
Enrichment analysis
Enrichment analysis shows potential biomarkers related to tumor growth and metastasis, including the TNF signaling, T cell receptor signaling, and Cholesterol Biosynthesis pathways (Figure 3). Genes KDM6A, KDM5D, KDM1A, and ZRSR2, linked to histone lysine demethylation, may affect PAAD progression via chromatin remodeling and gene expression [50]. Genes TMSB4Y and NLGN4Y are involved in actin nucleation and may influence PAAD through cell motility and invasiveness [51]. The gene TMSB4Y is linked to steroid hormone receptor signaling and may influence PAAD progression through hormone-mediated processes. KDM6A and RASGRP1 positively regulate oxidoreductase activity, affecting PAAD by altering redox homeostasis and metabolism. TNF and RASGRP1 also enhance MAP kinase activity, impacting PAAD via MAPK-mediated processes. The genes EDN1, TNF, and USP9Y positively regulate NO, affecting PAAD through NO-mediated functions. EDN1 and SQLE negatively regulate wound healing, influencing the tumor microenvironment and angiogenesis [52]. These interconnected biological processes can significantly impact PAAD development and progression, with the roles of these genes requiring further investigation (Figure 3A). The top significant p-values and q-values for the GO biological processes of 2023, along with key DEGs identified as overlapping genes, are presented in Table 1.
Our analysis indicates that the MLL3/4 complex (Figure 3B), which functions as a histone H3K4 demethylase, is involved in histone modification and gene expression regulation. Dysregulation of this complex can lead to abnormal gene expression and disease progression [53]. Significant p-values and q-values for the GO cellular component of 2023, along with key DEGs identified as overlapping genes, are shown in Table 2. Different synapse types affect PAAD tumor growth and invasion (Figure 3B). Dysregulation of asymmetric Glutamatergic excitatory synapses alters neurotransmission and can influence cell proliferation and migration. Symmetric synapses, involved in intercellular communication, are also affected, impacting normal tissue and contributing to PAAD. Inhibitory GABA-ergic synapses regulate neuronal excitability, and their dysregulation can influence cancer progression [54],[55]. Additionally, cellular components like early endosome membranes and germ plasmas are directly involved in PAAD (Figure 3B). Inherited mutations in genes like UTY, KDM6A, NLGN4Y, and DDX3Y may increase the risk of developing pancreatic cancer. Table 3 (Figure 3C) shows the most significant p-values and q-values for GO molecular functions in 2023, along with key DEGs identified as overlapping genes for these functions.
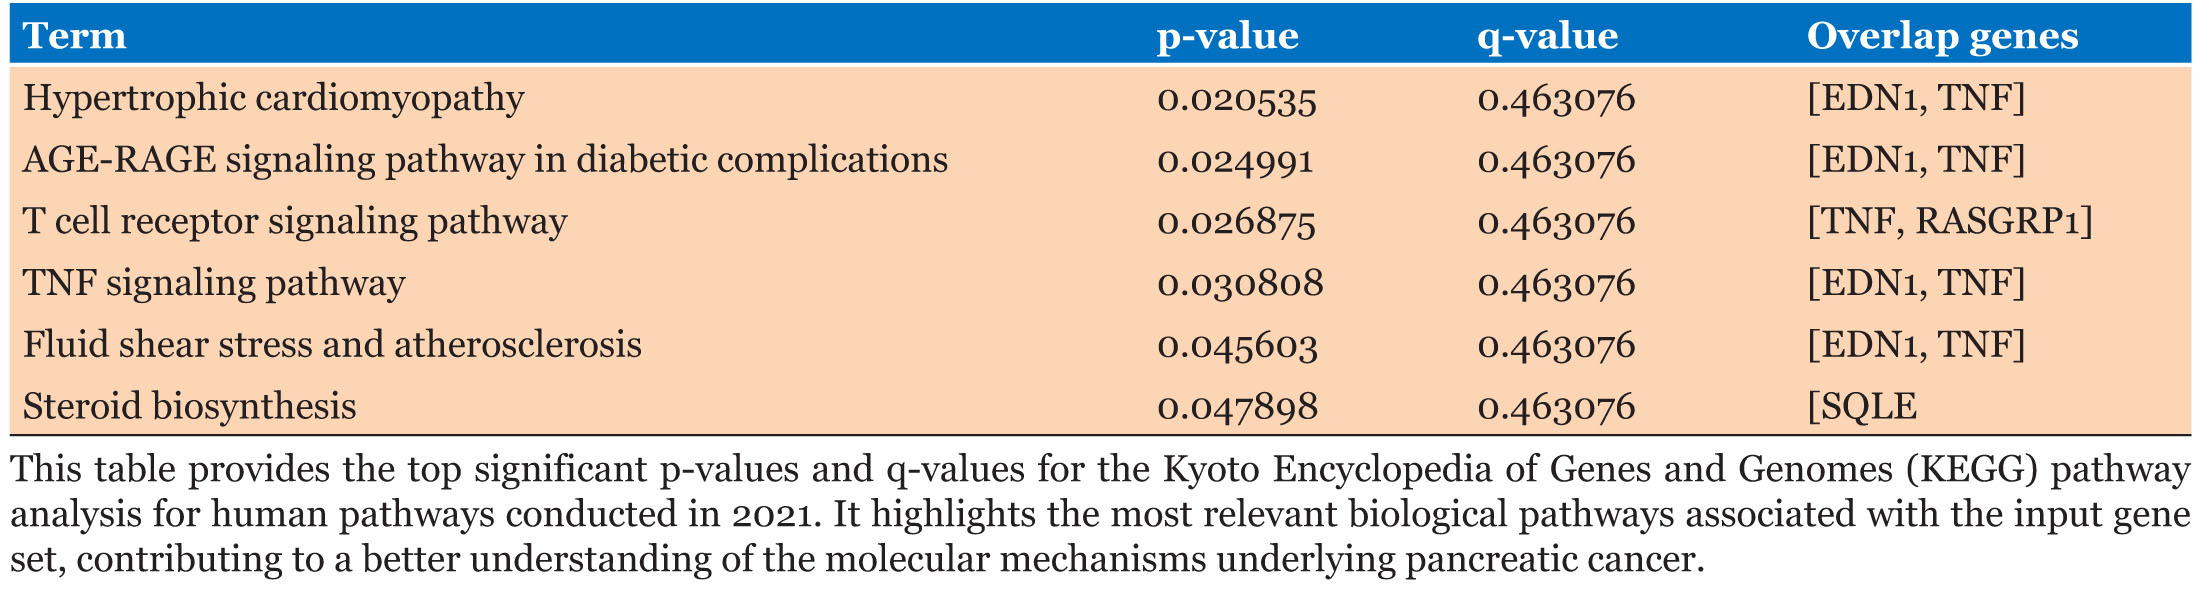
We identified pathways from KEGG, Reactome, and WikiPathway linked to pancreatic cancer. The AGE-RAGE signaling pathway (Figure 3D) contributes to diabetic complications and pancreatic cancer through inflammation and oxidative stress [56]. Alterations in T cell receptor and TNF signaling pathways (Figure 3D) promote tumor growth and survival in pancreatic cancer [57]. Table 4 lists significant DEGs overlapping with KEGG pathways, including key p-values and q-values.
Figure 3E shows the Reactome linked pathways which are involved in PAAD. Histone demethylases (HDMs) Demethylate Histones and Chromatin Modifying Enzymes: Both enzymes are involved in alteration of histone proteins and chromatin respectively which leads to cancer. TNFR1 activates ceramide production, influencing cell death and inflammation. It also triggers pro-apoptotic signaling pathways. Inactivation of ERKs, which are crucial for cell proliferation and differentiation, can disrupt these processes. Additionally, Rap1, a small GTPase, is involved in signaling related to cell adhesion, proliferation, and differentiation. Dysregulation of these pathways is linked to pancreatic cancer development and progression (Figure 3E). The significant DEGs that overlap with the Reactome pathways, as well as the top significant p-values and q-values for Reactome are given in Table 5.
WikiPathways analysis shows the RIG-I-like receptor (RLR) pathway that is dysregulated in pancreatic cancer, promoting tumor growth and immune invasion. Sterol regulatory element-binding proteins (SREBP) signaling is upregulated, aiding tumor growth and survival. Extracellular vesicles (EVs) from cancer cells also enhance tumor growth and metastasis. These pathways impact immune response, cell proliferation, and metabolism, revealing potential therapeutic targets in pancreatic cancer (Figure 3F). The significant DEGs that overlap with the WikiPathways, as well as the top significant p-values and q-values for WikiPathways are given in Table 6.
Network analysis identified key signaling pathways involved in pancreatic cancer are Notch-mediated HESHEY network, Regulation of Ras family activation, and EGFR-dependent Endothelin signaling (Figure 4). Our result shows KDM1A gene identified as the key regulator of Notch pathway in PAAD (Figure 4A). RASGRP gene plays a crucial role in modulating Ras activation regulatory pathway (Figure 4B). Our RNA-Seq analysis identified the gene EDN1 as a regulator of the EGFR pathway in pancreatic cancer (Figure 4C). Understanding these pathways could aid in developing targeted therapies for this aggressive disease. Endothelin and TCR signaling networks in naïve CD8 T cells are impacted by pancreatic adenocarcinoma (PAAD). Our analysis identified the gene EDN1 as a key modulator of the Gi, Gs, and Gq family gene networks (Supplementary Figure SF1). RASGRP gene was found to influence the B7 and Ras family gene networks (Supplementary Figure SF2). We also identified two pathways in pancreatic cancer: WP197 (Supplementary Figure SF4), the cholesterol biosynthesis pathway, which is crucial for cell membrane production and is altered in cancer cells. Targeting this pathway with HMG-CoA reductase inhibitors has shown anti-tumor effects [58]. The second pathway, WP732 (Supplementary Figure SF4), involves serotonin receptor 2 and ELK-SRF GATA4 signaling, where serotonin receptor activation promotes cancer cell proliferation and migration. Inhibiting this receptor may yield anti-tumor effects [54].
Biomarkers and survival analysis
Our findings show important genetic biomarkers linked to pancreatic cancer:
UTY: Regulates chromatin structure and gene expression, facilitating oncogenic transformation and linked to epithelial-mesenchymal transition. KDM6A: A tumor suppressor that demethylases H3K27me3, with loss or mutation contributing to altered gene expression and cancer development. KDM5D: Involved in male-specific functions, it may influence pancreatic cancer through H3K4me2/3 demethylation. KDM1A: Promotes cancer cell growth and metastasis; its inhibition is a potential therapeutic strategy. TMSB4Y: Encodes a protein that stimulates angiogenesis and cell migration, serving as a potential biomarker. EDN1: Enhances tumor angiogenesis by promoting endothelial cell proliferation and migration. TNF: Promotes cell proliferation, angiogenesis, and immune cell recruitment to tumors. RASGRP1: Activates the Ras signaling pathway, contributing to cancer progression. ZRSR2: Involved in RNA splicing; its specific role in pancreatic cancer requires further study. USP9Y: Its role is unclear but may relate to sex hormones and sexual dimorphism in cancer. SQLE: Dysregulation may impact lipid metabolism, influencing cell proliferation and survival. NLGN4Y: Its significance in pancreatic cancer is not established, though links to nervous system interactions exist. These genes influence pancreatic cancer through protein interactions, epigenetic regulation, and cellular pathways involved in tumorigenesis, providing insights for targeted therapies and improved diagnostics.
The study utilized gene enrichment analysis and Kaplan–Meier (KM) plots to explore gene expression in pancreatic cancer, revealing that prognosis was not significantly affected by gender (Supplementary Figure SF5). Key findings indicate TNF as a potential treatment strategy and Ras as a predictive indicator. Differential expression analysis shows KDM6A, RASGRP, TNF, and ZRSR2 genes which were downregulated, while EDN1, KDM1A, KDM5D, NLGN4Y, SQLE, TMSB4Y, USP9Y, and UTY were upregulated (Supplementary Figure SF3). Notably, NLGN4Y, TMSB4Y, UTY, USP9Y, and KDM5D were highly expressed in stages II and III, while EDN1, KDM1A, KDM6A, and SQLE peaked in stage IV (Figure 6). KDM1A and KDM3A were linked to poor prognosis, with their knockdown impairing tumor growth. The histone methyltransferase G9a and transcription factor RFXAP also emerged as significant in pancreatic carcinogenesis, suggesting potential therapeutic targets [53].
We analyzed survival probabilities over time to identify genes linked to cancer recurrence or mortality. Figure 5 presenting results in a survival plot for gene have high and low expression. Survival analysis indicated that genes EDN1, KDM1A, RASGRP, and SQLE had hazard ratios (HR) greater than 1, with SQLE showing a significant logrank p-value of 0.00074, indicating a notable difference in survival rates.




Conclusion
Our study shows that notable biomarkers, including CD5L, LILRB1, and KEL, were linked to disease pathology. Enrichment analysis revealed critical biological pathways, such as TNF signaling and T cell receptor pathways, associated with tumor growth and metastasis. Genes like KDM6A and TMSB4Y were implicated in chromatin remodeling and cell motility, underscoring their roles in cancer progression. Additionally, dysregulation of nitric oxide production and steroid hormone signaling pathways further contributed to PAAD development. Our exploration of cellular components and signaling networks highlighted the importance of the MLL3/4 complex and synaptic alterations in tumor growth. Survival analysis indicated that specific DEGs correlate with patient outcomes, suggesting their potential as biomarkers for diagnosis and treatment. Overall, this research enhances our understanding of the molecular mechanisms driving PAAD and identifies promising targets for future therapeutic interventions, emphasizing the need for further investigation into these pathways to improve patient outcomes. Further research is needed to clarify the mechanisms and therapeutic potential of these genes, alongside addressing current research limitations and knowledge gaps in pancreatic cancer treatment.
SUPPLEMENTARY FIGURES


REFERENCES
1.
Lippi G, Mattiuzzi C. The global burden of pancreatic cancer. Arch Med Sci 2020;16(4):820–4. [CrossRef]
[Pubmed]

2.
Yuan C, Kim J, Wang QL, et al. The age-dependent association of risk factors with pancreatic cancer. Ann Oncol 2022;33(7):693–701. [CrossRef]
[Pubmed]
3.
Olakowski M, Bułdak Ł. Current status of inherited pancreatic cancer. Hered Cancer Clin Pract 2022;20(1):26. [CrossRef]
[Pubmed]
4.
Asif M, Ahmad SW, Ahmad SF, Banu AN, Jamil M, Arshad N. Diabetes as a risk factor of pancreatic cancer. Pakistan Journal of Medical & Health Sciences 2022;16(2):1245–7. [CrossRef]
5.
Liu T, Song C, Zhang Y, et al. Hepatitis B virus infection and the risk of gastrointestinal cancers among Chinese population: A prospective cohort study. Int J Cancer 2022;150(6):1018–28. [CrossRef]
[Pubmed]
6.
Saiki Y, Jiang C, Ohmuraya M, Furukawa T. Genetic mutations of pancreatic cancer and genetically engineered mouse models. Cancers (Basel) 2021;14(1):71. [CrossRef]
[Pubmed]
7.
Paradise BD, Barham W, Fernandez-Zapico ME. Targeting epigenetic aberrations in pancreatic cancer, a new path to improve patient outcomes? Cancers (Basel) 2018;10(5):128. [CrossRef]
[Pubmed]
8.
Zhang W, Jiang T, Xie K. Epigenetic reprogramming in pancreatic premalignancy and clinical implications. Front Oncol 2023;13:1024151. [CrossRef]
[Pubmed]
9.
Pelosi E, Castelli G, Testa U. Pancreatic cancer: Molecular characterization, clonal evolution and cancer stem cells. Biomedicines 2017;5(4):65. [CrossRef]
[Pubmed]
10.
Pilarsky C, Grutzmann R. Genomics of pancreatic ductal adenocarcinoma. Hepatobiliary Pancreat Dis Int 2014;13(4):381–5. [CrossRef]
[Pubmed]
11.
Anderson EM, Thomassian S, Gong J, Hendifar A, Osipov A. Advances in pancreatic ductal adenocarcinoma treatment. Cancers (Basel) 2021;13(21):5510. [CrossRef]
[Pubmed]
12.
Storz P, Crawford HC. Carcinogenesis of pancreatic ductal adenocarcinoma. Gastroenterology 2020;158(8):2072–81. [CrossRef]
[Pubmed]
13.
Saleh Z, Moccia MC, Ladd Z, et al. Pancreatic neuroendocrine tumors: Signaling pathways and epigenetic regulation. Int J Mol Sci 2024;25(2):1331. [CrossRef]
[Pubmed]
14.
Stauffer JA, Asbun HJ. Rare tumors and lesions of the pancreas. Surg Clin North Am 2018;98(1):169–88. [CrossRef]
[Pubmed]
15.
Li Q, Zhang X, Ke R. Spatial transcriptomics for tumor heterogeneity analysis. Front Genet 2022;13:906158. [CrossRef]
[Pubmed]
16.
Rabow MW, Petzel MQB, Adkins SH. Symptom management and palliative care in pancreatic cancer. Cancer J 2017;23(6):362–73. [CrossRef]
[Pubmed]
17.
Khan AA, Liu X, Yan X, Tahir M, Ali S, Huang H. An overview of genetic mutations and epigenetic signatures in the course of pancreatic cancer progression. Cancer Metastasis Rev 2021;40(1):245–72. [CrossRef]
[Pubmed]
18.
Kim HS, Shi J. Epigenetics in precision medicine of pancreatic cancer. In: Epigenetics in Precision Medicine. Academic Press; 2021. p. 257–79.
19.
Barhli A, Cros J, Bartholin L, Neuzillet C. Prognostic stratification of resected pancreatic ductal adenocarcinoma: Past, present, and future. Dig Liver Dis 2018;50(10):979–90. [CrossRef]
[Pubmed]
20.
Fu H, Sun H, Kong H, et al. Discoveries in pancreatic physiology and disease biology using single-cell RNA sequencing. Front Cell Dev Biol 2022;9:732776. [CrossRef]
[Pubmed]
21.
Yu W, Diao Y, Zhang Y, et al. Bioinformatic analysis of FOXN3 expression and prognostic value in pancreatic cancer. Front Oncol 2022;12:1008100. [CrossRef]
[Pubmed]
22.
Shi T, Gao G. Identify potential prognostic indicators and tumor-infiltrating immune cells in pancreatic adenocarcinoma. Biosci Rep 2022;42(2):BSR20212523. [CrossRef]
[Pubmed]
23.
Colaprico A, Silva TC, Olsen C, et al. TCGAbiolinks: An R/bioconductor package for integrative analysis of TCGA data. Nucleic Acids Res 2016;44(8):e71. [CrossRef]
[Pubmed]
24.
Schwarzer G. R Core Team R: A Language and Environment for Statistical Computing. R News [Internet]. 2007;40–5. [Available at: http://www.r-project.org/]
25.
Ihaka R, Gentleman R. R: A language for data analysis and graphics. Journal of Computational and Graphical Statistics 1996;5(3):299–314. [CrossRef]
26.
Robinson MD, McCarthy DJ, Smyth GK. edgeR: A Bioconductor package for differential expression analysis of digital gene expression data. Bioinformatics 2010;26(1):139–40. [CrossRef]
[Pubmed]
27.
Law CW, Chen Y, Shi W, Smyth GK. voom: Precision weights unlock linear model analysis tools for RNA-seq read counts. Genome Biol 2014;15(2):R29. [CrossRef]
[Pubmed]
28.
Ritchie ME, Phipson B, Wu D, et al. Limma powers differential expression analyses for RNA-sequencing and microarray studies. Nucleic Acids Res 2015;43(7):e47. [CrossRef]
[Pubmed]
29.
Love MI, Huber W, Anders S. Moderated estimation of fold change and dispersion for RNA-seq data with DESeq2. Genome Biol 2014;15(12):550. [CrossRef]
[Pubmed]
30.
Robinson MD, Oshlack A. A scaling normalization method for differential expression analysis of RNA-seq data. Genome Biol 2010;11(3):R25. [CrossRef]
[Pubmed]
31.
Ogutu JO, Schulz-Streeck T, Piepho HP. Genomic selection using regularized linear regression models: Ridge regression, lasso, elastic net and their extensions. BMC Proc 2012;6(Suppl 2):S10. [CrossRef]
[Pubmed]
32.
Friedman J, Hastie T, Simon N, Tibshirani R, Hastie T. Lasso and elastic-net regularized generalized linear models. R package version 1.9–8. CRAN. 2014.
33.
Mackiewicz A, Ratajczak W. Principal components analysis (PCA). Comput Geosci 1993;19(3):303–42.
34.
Kuhn M, Wing J, Weston S, et al. caret: Classification and regression training. 2020. R Package version. 2021.
35.
Friedman J, Hastie T, Tibshirani R. Regularization paths for generalized linear models via coordinate descent. J Stat Softw 2010;33(1):1–22.
[Pubmed]
36.
Morgan M, Obenchain V, Hester J, Pagès H. Summarized Experiment: Summarized Experiment container. R package version 1.12.0. 2021.
37.
Therneau TM. A Package for Survival Analysis in R. R packag version 238 [Internet]. 2023. [Available at: https://cran.r-project.org/package=survival]
38.
Abd ElHafeez S, D’Arrigo G, Leonardis D, Fusaro M, Tripepi G, Roumeliotis S. Methods to analyze time-to- event data: The Cox regression analysis. Oxid Med Cell Longev 2021;2021:1302811. [CrossRef]
[Pubmed]
39.
Kassambara A, Kosinski M, Biecek P. Survminer: Drawing Survival Curves using ‘ggplot2’_. R package version 0.5.0.999, 2024. [Available at: https://github.com/kassambara/survminer]
40.
Kuleshov MV, Jones MR, Rouillard AD, et al. Enrichr: A comprehensive gene set enrichment analysis web server 2016 update. Nucleic Acids Res 2016;44(W1):W90–7. [CrossRef]
[Pubmed]
41.
Ashburner M, Ball CA, Blake JA, et al. Gene ontology: Tool for the unification of biology. The Gene Ontology Consortium. Nat Genet 2000;25(1):25–9. [CrossRef]
[Pubmed]
42.
Kanehisa M, Goto S. KEGG: Kyoto Encyclopedia of Genes and Genomes. Nucleic Acids Res 2000;28(1):27–30. [CrossRef]
[Pubmed]
43.
Martens M, Ammar A, Riutta A, et al. WikiPathways: Connecting communities. Nucleic Acids Res 2021;49(D1):D613–21. [CrossRef]
[Pubmed]
44.
Shannon P, Markiel A, Ozier O, et al. Cytoscape: A software environment for integrated models of biomolecular interaction networks. Genome Res 2003;13(11):2498–504. [CrossRef]
[Pubmed]
45.
Warnes GR, Bolker B, Bonebakker L, et al. gplots: Various R programming tools for plotting data. R package version 2.12. 1. 2013. [Available at: http://CRANR-project.org/package=gplots]
46.
Gómez-Rubio V. ggplot2 – Elegant Graphics for Data Analysis (2nd Edition). Journal of Statistical Software, Book Reviews 2017;77(2):1–3. [CrossRef]
47.
Wilke CO. cowplot: Streamlined Plot Theme and Plot Annotations for “ggplot2”. R package version 100 [Internet]. 2019;1–44. [Available at: https://cran.r-project.org/package=cowplot]
48.
Su S, Law CW, Ah-Cann C, Asselin-Labat ML, Blewitt ME, Ritchie ME. Glimma: Interactive graphics for gene expression analysis. Bioinformatics 2017;33(13):2050–2. [CrossRef]
[Pubmed]
49.
Neuwirth E. RColorBrewer: ColorBrewer palettes. R package version 11-2 [Internet]. 2014;1(4). [Available at: https://cran.r-project.org/web/packages/RColorBrewer/index.html]
50.
Sterling J, Menezes SV, Abbassi RH, Munoz L. Histone lysine demethylases and their functions in cancer. Int J Cancer 2021;148(10):2375–88. [CrossRef]
[Pubmed]
51.
Zhang Y, Feurino LW, Zhai Q, et al. Thymosin beta 4 is overexpressed in human pancreatic cancer cells and stimulates proinflammatory cytokine secretion and JNK activation. Cancer Biol Ther 2008;7(3):419–23. [CrossRef]
[Pubmed]
52.
Thomas D, Radhakrishnan P. Tumor-stromal crosstalk in pancreatic cancer and tissue fibrosis. Mol Cancer 2019;18(1):14. [CrossRef]
[Pubmed]
53.
Wang LH, Aberin MAE, Wu S, Wang SP. The MLL3/4 H3K4 methyltransferase complex in establishing an active enhancer landscape. Biochem Soc Trans 2021;49(3):1041–54. [CrossRef]
[Pubmed]
54.
Liang Y, Li H, Gan Y, Tu H. Shedding light on the role of neurotransmitters in the microenvironment of pancreatic cancer. Front Cell Dev Biol 2021;9:688953. [CrossRef]
[Pubmed]
55.
Wakiya T, Ishido K, Yoshizawa T, Kanda T, Hakamada K. Roles of the nervous system in pancreatic cancer. Ann Gastroenterol Surg 2021;5(5):623–33. [CrossRef]
[Pubmed]
56.
Vulichi SR, Runthala A, Begari N, et al. Type-2 diabetes mellitus-associated cancer risk: In pursuit of understanding the possible link. Diabetes Metab Syndr 2022;16(9):102591. [CrossRef]
[Pubmed]
57.
Chopra M, Lang I, Salzmann S, et al. Tumor necrosis factor induces tumor promoting and anti-tumoral effects on pancreatic cancer via TNFR1. PLoS One 2013;8(9):e75737. [CrossRef]
[Pubmed]
58.
Gabitova-Cornell L, Surumbayeva A, Peri S, et al. Cholesterol pathway inhibition induces TGF-β signaling to promote basal differentiation in pancreatic cancer. Cancer Cell 2020;38(4):567–83.e11. [CrossRef]
[Pubmed]
SUPPORTING INFORMATION
Author Contributions
Ehtesham Ahmed Shariff - Conception of the work, Design of the work, Acquisition of data, Revising the work critically for important intellectual content, Final approval of the version to be published, Agree to be accountable for all aspects of the work in ensuring that questions related to the accuracy or integrity of any part of the work are appropriately investigated and resolved.
Amjad Khan - Conception of the work, Design of the work, Acquisition of data, Revising the work critically for important intellectual content, Final approval of the version to be published, Agree to be accountable for all aspects of the work in ensuring that questions related to the accuracy or integrity of any part of the work are appropriately investigated and resolved.
Zafrul Hasan - Conception of the work, Design of the work, Acquisition of data, Revising the work critically for important intellectual content, Final approval of the version to be published, Agree to be accountable for all aspects of the work in ensuring that questions related to the accuracy or integrity of any part of the work are appropriately investigated and resolved.
Ahmed Azharuddin - Conception of the work, Design of the work, Acquisition of data, Revising the work critically for important intellectual content, Final approval of the version to be published, Agree to be accountable for all aspects of the work in ensuring that questions related to the accuracy or integrity of any part of the work are appropriately investigated and resolved.
Rabeena Tabassum - Conception of the work, Design of the work, Acquisition of data, Revising the work critically for important intellectual content, Final approval of the version to be published, Agree to be accountable for all aspects of the work in ensuring that questions related to the accuracy or integrity of any part of the work are appropriately investigated and resolved.
Khalaf Mahdi Al-Enazi - Conception of the work, Design of the work, Acquisition of data, Revising the work critically for important intellectual content, Final approval of the version to be published, Agree to be accountable for all aspects of the work in ensuring that questions related to the accuracy or integrity of any part of the work are appropriately investigated and resolved.
Guarantor of SubmissionThe corresponding author is the guarantor of submission.
Source of SupportNone
Consent StatementWritten informed consent was obtained from the patient for publication of this article.
Data AvailabilityAll relevant data are within the paper and its Supporting Information files.
Conflict of InterestAuthors declare no conflict of interest.
Copyright© 2025 Ehtesham Ahmed Shariff et al. This article is distributed under the terms of Creative Commons Attribution License which permits unrestricted use, distribution and reproduction in any medium provided the original author(s) and original publisher are properly credited. Please see the copyright policy on the journal website for more information.